


 mobilbude
Hallo zusammen,
habt ihr schon das Update 1903 von Windows?
Wenn ja, habt ihr mal Latancymon laufen lassen und sind bei euch auch die Latenzwerte
in die höhe gegangen.
Zudem geht bei mir die ntoskrnl.exe sehr hoch.
Bei wem ist das noch so?
Treiber und BIOS auf dem aktuellen Stand, dass Problem ist auch erst seit dem 1903 Update.
Bitte nicht schreiben, Update entfernen. Danke
Mensajes Tue 25 Jun 19 @ 9:36 am
 djragman
Update entfernen ;-)
Nein - im Ernst: seit dem Update auf 1903 ist mein Läppi auch mehr am Rödeln und braucht länger zum Hochfahren, bis er sich dann nach paar Minuten etwas (!) beruhigt. Bisher läuft es aber immerhin stabil.
Irgendwie hab ich das Gefühl, dass nach dem Abschluss des Updates doch noch nicht alles installiert ist und irgendwie noch vom NTOSkrnl auf Speicher usw. verteilt und/oder ausgeführt wird.
Mensajes Wed 26 Jun 19 @ 11:09 am
mobilbude
Ja, dass ist so.
Irgendwo habe ich im Internet etwas auf englisch gefunden,
dass Microsoft und Nvidia an einem Update arbeiten.
Lass mal den Latancymon für ca 30 Minuten laufen.
ERSCHRECKENDES ERGEBNISS!
Irgendwo habe ich im Internet etwas auf englisch gefunden,
dass Microsoft und Nvidia an einem Update arbeiten.
Lass mal den Latancymon für ca 30 Minuten laufen.
ERSCHRECKENDES ERGEBNISS!
Mensajes Wed 26 Jun 19 @ 12:30 pm
djragman
Da brauch ich keinen Latencymon für, um das zu erkennen. Da reicht schon die Anzeige von VDJ :-)
Wieder sowas unausgegorenes aus dem Hause Microsoft. Würde mich nicht wundern, wenn sie auch dieses Mal wieder zurückrudern.
Wieder sowas unausgegorenes aus dem Hause Microsoft. Würde mich nicht wundern, wenn sie auch dieses Mal wieder zurückrudern.
Mensajes Wed 26 Jun 19 @ 1:59 pm
 metrix
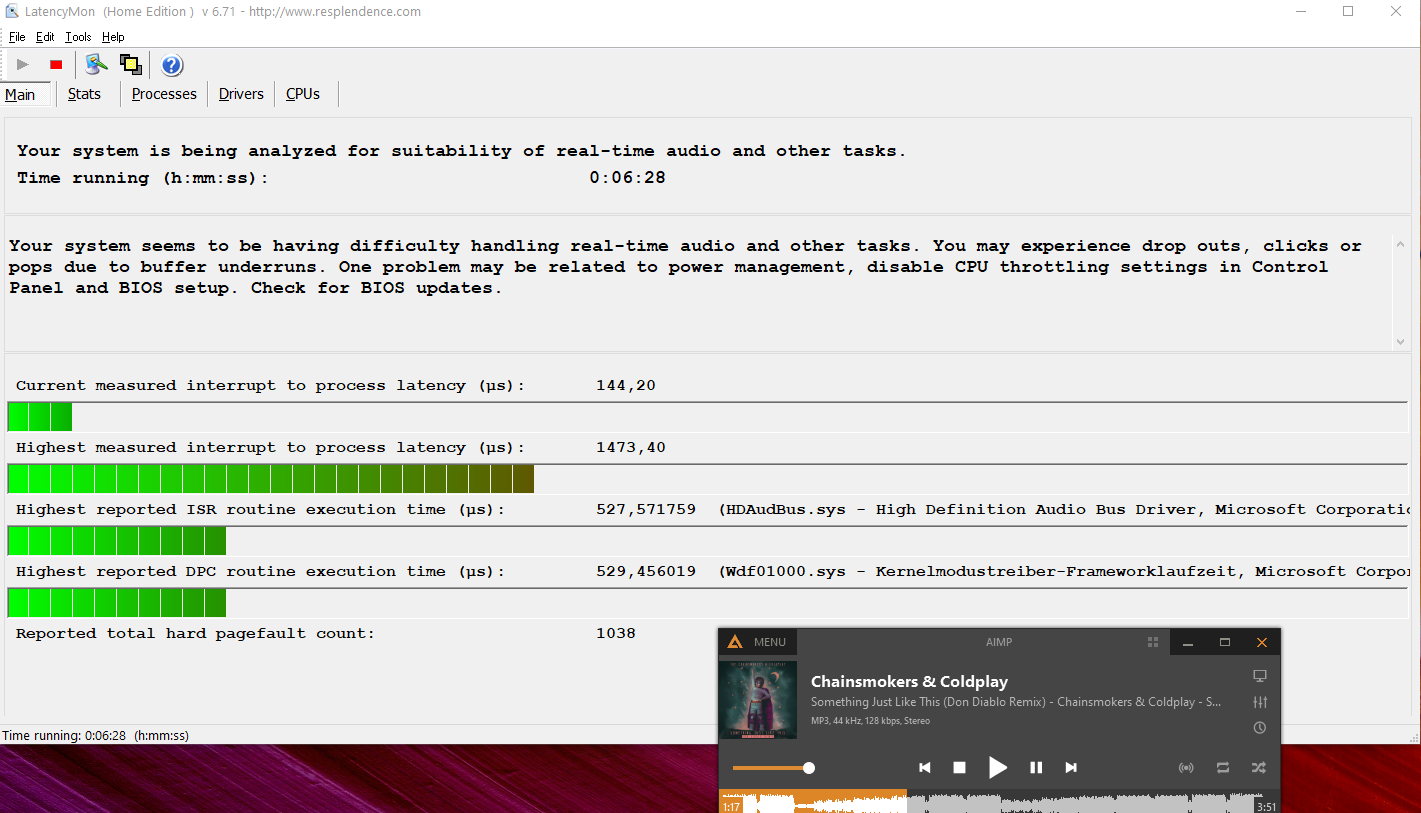
ist das gut oder nicht?
SYSTEM INFORMATION
_________________________________________________________________________________________________________
Computer name: Metrix
OS version: Windows 10 , 10.0, version 1903, build: 18362 (x64)
Hardware: COMPUTER INC.
CPU: Genuine Intel(R) Core(TM) i7-6700HQ CPU @ 2.60GHz
Logical processors: 8
Processor groups: 1
RAM: 16279 MB total
_________________________________________________________________________________________________________
CPU SPEED
_________________________________________________________________________________________________________
Reported CPU speed: 2592 MHz
Note: reported execution times may be calculated based on a fixed reported CPU speed. Disable variable speed settings like Intel Speed Step and AMD Cool N Quiet in the BIOS setup for more accurate results.
WARNING: the CPU speed that was measured is only a fraction of the CPU speed reported. Your CPUs may be throttled back due to variable speed settings and thermal issues. It is suggested that you run a utility which reports your actual CPU frequency and temperature.
_________________________________________________________________________________________________________
MEASURED INTERRUPT TO USER PROCESS LATENCIES
_________________________________________________________________________________________________________
The interrupt to process latency reflects the measured interval that a usermode process needed to respond to a hardware request from the moment the interrupt service routine started execution. This includes the scheduling and execution of a DPC routine, the signaling of an event and the waking up of a usermode thread from an idle wait state in response to that event.
Highest measured interrupt to process latency (µs): 1473,40
Average measured interrupt to process latency (µs): 4,599543
Highest measured interrupt to DPC latency (µs): 1432,90
Average measured interrupt to DPC latency (µs): 1,279534
_________________________________________________________________________________________________________
REPORTED ISRs
_________________________________________________________________________________________________________
Interrupt service routines are routines installed by the OS and device drivers that execute in response to a hardware interrupt signal.
Highest ISR routine execution time (µs): 527,571759
Driver with highest ISR routine execution time: HDAudBus.sys - High Definition Audio Bus Driver, Microsoft Corporation
Highest reported total ISR routine time (%): 0,016165
Driver with highest ISR total time: HDAudBus.sys - High Definition Audio Bus Driver, Microsoft Corporation
Total time spent in ISRs (%) 0,017236
ISR count (execution time <250 µs): 23137
ISR count (execution time 250-500 µs): 0
ISR count (execution time 500-999 µs): 5
ISR count (execution time 1000-1999 µs): 0
ISR count (execution time 2000-3999 µs): 0
ISR count (execution time >=4000 µs): 0
_________________________________________________________________________________________________________
REPORTED DPCs
_________________________________________________________________________________________________________
DPC routines are part of the interrupt servicing dispatch mechanism and disable the possibility for a process to utilize the CPU while it is interrupted until the DPC has finished execution.
Highest DPC routine execution time (µs): 532,847994
Driver with highest DPC routine execution time: Wdf01000.sys - Kernelmodustreiber-Frameworklaufzeit, Microsoft Corporation
Highest reported total DPC routine time (%): 0,012863
Driver with highest DPC total execution time: rspLLL64.sys - Resplendence Latency Monitoring and Auxiliary Kernel Library, Resplendence Software Projects Sp.
Total time spent in DPCs (%) 0,046024
DPC count (execution time <250 µs): 527405
DPC count (execution time 250-500 µs): 0
DPC count (execution time 500-999 µs): 12
DPC count (execution time 1000-1999 µs): 0
DPC count (execution time 2000-3999 µs): 0
DPC count (execution time >=4000 µs): 0
_________________________________________________________________________________________________________
REPORTED HARD PAGEFAULTS
_________________________________________________________________________________________________________
Hard pagefaults are events that get triggered by making use of virtual memory that is not resident in RAM but backed by a memory mapped file on disk. The process of resolving the hard pagefault requires reading in the memory from disk while the process is interrupted and blocked from execution.
NOTE: some processes were hit by hard pagefaults. If these were programs producing audio, they are likely to interrupt the audio stream resulting in dropouts, clicks and pops. Check the Processes tab to see which programs were hit.
Process with highest pagefault count: searchui.exe
Total number of hard pagefaults 1725
Hard pagefault count of hardest hit process: 252
Number of processes hit: 33
_________________________________________________________________________________________________________
PER CPU DATA
_________________________________________________________________________________________________________
CPU 0 Interrupt cycle time (s): 14,899937
CPU 0 ISR highest execution time (µs): 527,571759
CPU 0 ISR total execution time (s): 0,617806
CPU 0 ISR count: 23142
CPU 0 DPC highest execution time (µs): 532,847994
CPU 0 DPC total execution time (s): 1,300521
CPU 0 DPC count: 500106
_________________________________________________________________________________________________________
CPU 1 Interrupt cycle time (s): 12,516166
CPU 1 ISR highest execution time (µs): 0,0
CPU 1 ISR total execution time (s): 0,0
CPU 1 ISR count: 0
CPU 1 DPC highest execution time (µs): 274,053241
CPU 1 DPC total execution time (s): 0,231253
CPU 1 DPC count: 18114
_________________________________________________________________________________________________________
CPU 2 Interrupt cycle time (s): 9,697374
CPU 2 ISR highest execution time (µs): 0,0
CPU 2 ISR total execution time (s): 0,0
CPU 2 ISR count: 0
CPU 2 DPC highest execution time (µs): 144,412037
CPU 2 DPC total execution time (s): 0,042045
CPU 2 DPC count: 2713
_________________________________________________________________________________________________________
CPU 3 Interrupt cycle time (s): 9,575095
CPU 3 ISR highest execution time (µs): 0,0
CPU 3 ISR total execution time (s): 0,0
CPU 3 ISR count: 0
CPU 3 DPC highest execution time (µs): 60,836420
CPU 3 DPC total execution time (s): 0,001450
CPU 3 DPC count: 161
_________________________________________________________________________________________________________
CPU 4 Interrupt cycle time (s): 7,688349
CPU 4 ISR highest execution time (µs): 0,0
CPU 4 ISR total execution time (s): 0,0
CPU 4 ISR count: 0
CPU 4 DPC highest execution time (µs): 247,201389
CPU 4 DPC total execution time (s): 0,053621
CPU 4 DPC count: 4835
_________________________________________________________________________________________________________
CPU 5 Interrupt cycle time (s): 14,133185
CPU 5 ISR highest execution time (µs): 0,0
CPU 5 ISR total execution time (s): 0,0
CPU 5 ISR count: 0
CPU 5 DPC highest execution time (µs): 79,675154
CPU 5 DPC total execution time (s): 0,004110
CPU 5 DPC count: 535
_________________________________________________________________________________________________________
CPU 6 Interrupt cycle time (s): 11,726538
CPU 6 ISR highest execution time (µs): 0,0
CPU 6 ISR total execution time (s): 0,0
CPU 6 ISR count: 0
CPU 6 DPC highest execution time (µs): 65,873457
CPU 6 DPC total execution time (s): 0,007060
CPU 6 DPC count: 542
_________________________________________________________________________________________________________
CPU 7 Interrupt cycle time (s): 12,807833
CPU 7 ISR highest execution time (µs): 0,0
CPU 7 ISR total execution time (s): 0,0
CPU 7 ISR count: 0
CPU 7 DPC highest execution time (µs): 133,773920
CPU 7 DPC total execution time (s): 0,009673
CPU 7 DPC count: 411
Mensajes Sat 29 Jun 19 @ 12:39 pm
mobilbude
Für 6 Minuten ist das gut.
Wie sieht es nach 6 Stunden aus?
Seit dem 27.06.19 gegen 22 Uhr gibt es zwei weitere Updates zu 1903.
Mein erster Eindruck sagt mir, seit dem ist es etwas besser geworden.
Wie sieht es nach 6 Stunden aus?
Seit dem 27.06.19 gegen 22 Uhr gibt es zwei weitere Updates zu 1903.
Mein erster Eindruck sagt mir, seit dem ist es etwas besser geworden.
Mensajes Sat 29 Jun 19 @ 3:18 pm
metrix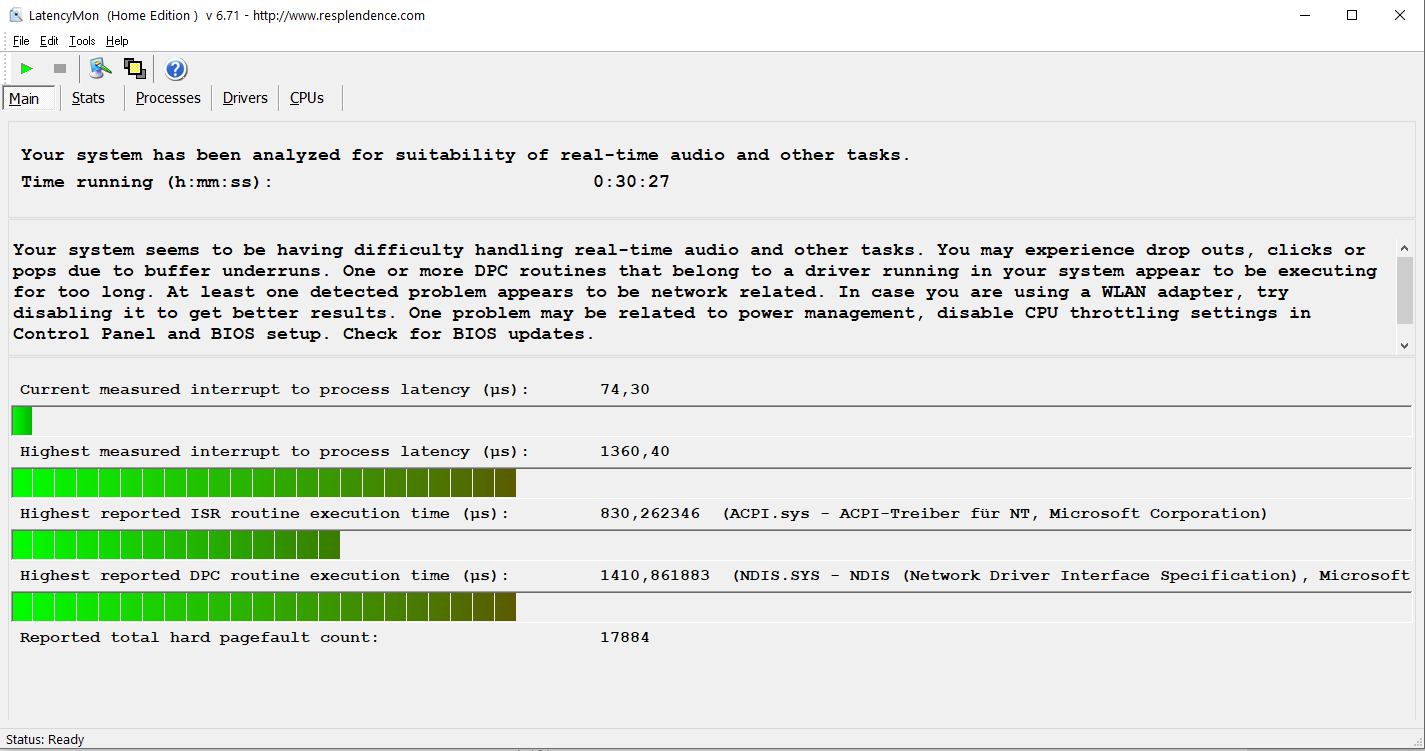
Mensajes Sat 29 Jun 19 @ 4:56 pm